Interactive Charts in SwiftUI
After the post about Charts in SwiftUI, some readers asked me how we can show the numbers in the chart when tapped. Today, we’re going to create a more interactive chart. We’re going to reuse code from this post, go check it if you haven’t.
The source code of today’s post is available here.
Step 0 - Preparation
In this demo, we’ll be using the same model and data array from the previous post. So let’s copy the code and paste it below the preview struct of ContentView.
import SwiftUI

struct ContentView: View {...}

struct ContentView_Previews: PreviewProvider {...}

//MARK: Data Source
//Model
struct SalesRecord: Identifiable {
    let id = UUID()
    let office: String
    let salesVolume: Int
}

//Data
let salesRecords: [SalesRecord] = [
    .init(office: "New York", salesVolume: 3000),
    .init(office: "San Fran", salesVolume: 2750),
    .init(office: "California", salesVolume: 4020),
    .init(office: "Denver", salesVolume: 930),
    .init(office: "Kansas", salesVolume: 2100)
]
Import Charts and then add the Chart with an Area Mark from the previous post. Let’s add a frame modifier to the Chart element with a height of 200.
import SwiftUI
import Charts

struct ContentView: View {
    var body: some View {
        NavigationStack {
            VStack {
                Chart {
                    ForEach(salesRecords) { record in
                        AreaMark(
                            x: .value("Office Location", record.office),
                            y: .value("Sales Volume", record.salesVolume)
                        )
                        .foregroundStyle(.linearGradient(colors: [.cyan, .cyan.opacity(0.2)], startPoint: .top, endPoint: .bottom))
                        .foregroundStyle(.pink.opacity(0.7))
                    }
                }
                .frame(height: 200)
                .padding()
                .navigationTitle("Sales Report")
            }
        }
    }
}
Step 1 - Add a Rule mark
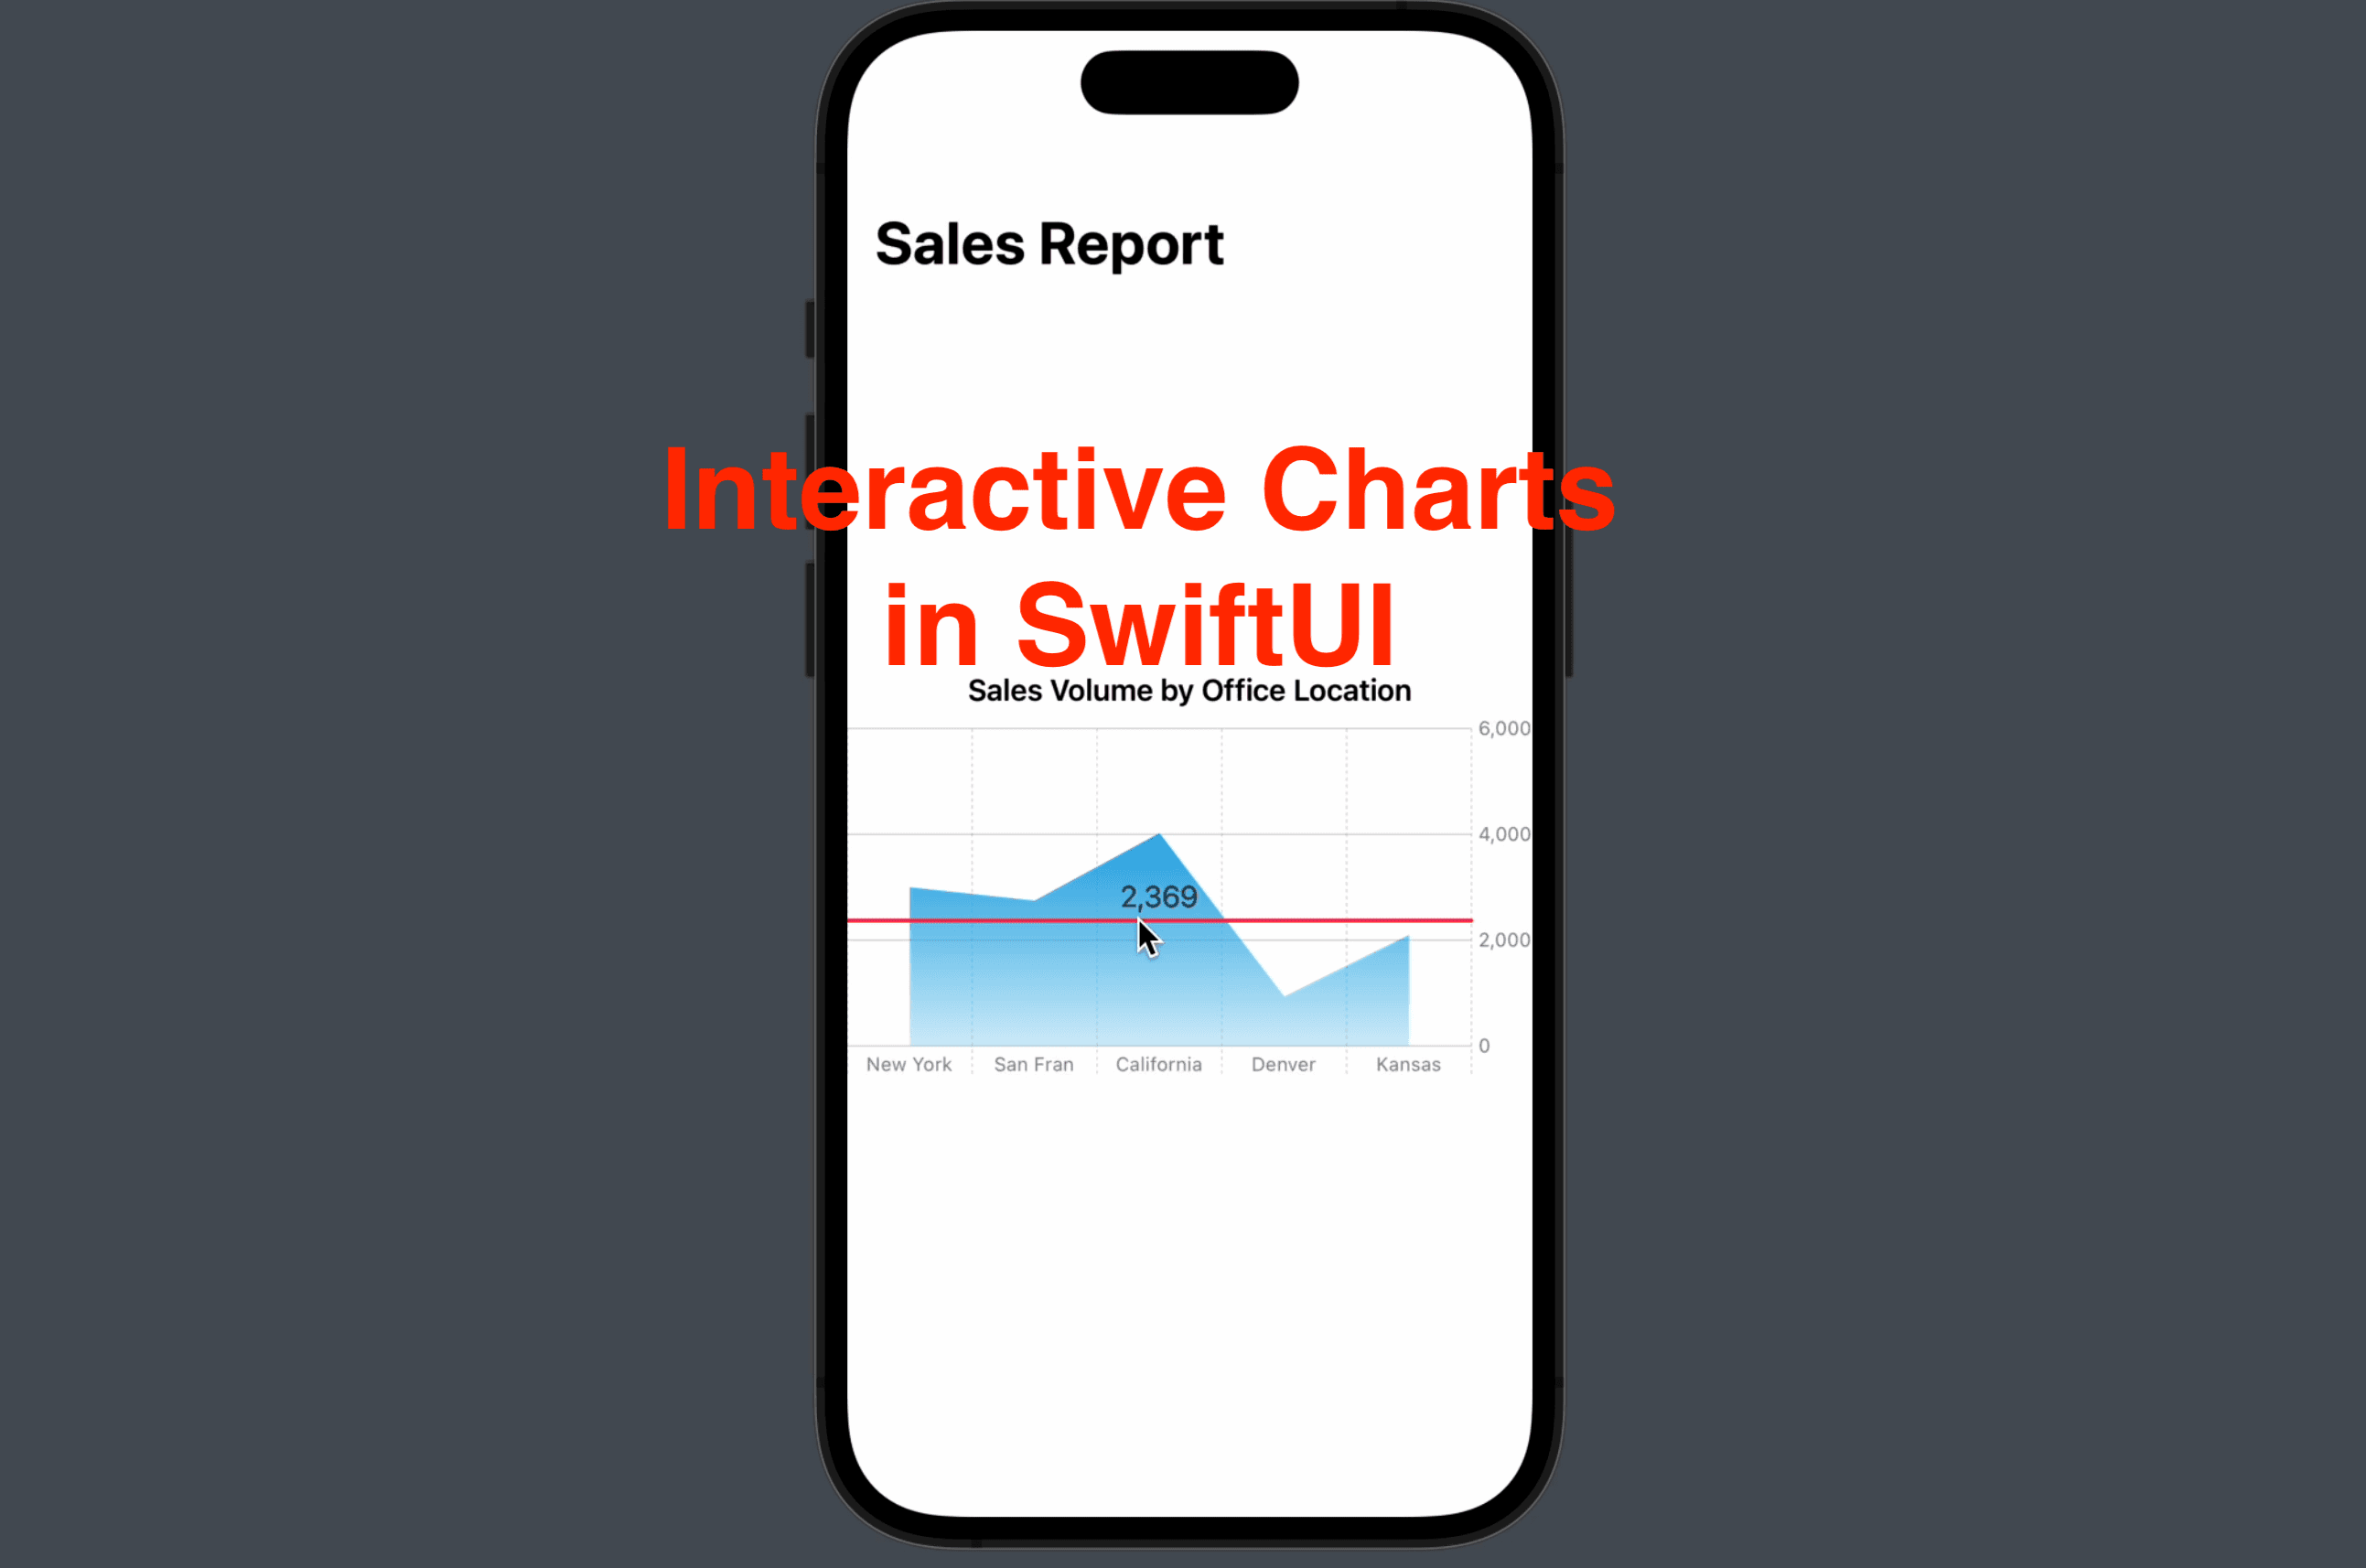
Add a Rule mark after the Area mark to indicate the sales volume (the value of Y-axis). Give it a foreground style of .pink and for now we’ll keep the plottable value constant at 1200.
RuleMark(y: .value("Sales", 1200))
    .foregroundStyle(.pink)
You should see a pink horizontal rule mark in your preview.

Step 2 - Add a State and make the Rule mark conditional
Since we only want the rule mark to show up when the plot area is touched, so we need to add a State property to let the view hold the selected value - a pair of office location and sales, therefore let’s add the line below:
struct ContentView: View {
    @State private var selectedRecord: (String, Int)? = nil
    //...
}
And we need the rule mark only when selectedRecord is not nil, so we need to put the rule mark inside a if statement where we check if selectedRecord is nil.
if let selectedRecord {
    if (selectedRecord.1 > 0 && selectedRecord.1 < 5000) {
            RuleMark(y: .value("Sales", 1200))
                .foregroundStyle(.pink)
    }
}
Now the Rule Mark should disappear since the state property selectedRecord is set to nil.
Step 3 - Update State according to gesture location
Now we need to let the view know when and where to show the rule mark.
But first, we need to know the location of the selected point at the chart and convert it to a CGPoint for the view. This is where we need chartOverlay and GeometryReader .
GeometryReader is a SwiftUI View that can help us determine the location (in x,y coordinates) of users selection here. and chartOverlay is a modifer for Chart elements, that allows us to map the location to chart values.
.frame(height: 200) // done previously
//-------new line: added chartOverlay
.chartOverlay { proxy in
    GeometryReader { geometry in
        Rectangle().fill(.clear).contentShape(Rectangle())
    }
}
The code above added a clear Rectangle above the chart (you can change .clear to .red temporarily to see it in the preview). Now we’ll add a .gesture modifier with a DragGesture for the Rectangle.
Rectangle().fill(.clear).contentShape(Rectangle())
    .gesture(DragGesture()
        .onChanged { value in
            // get plot area coordiate from gesture location
            let origin = geometry[proxy.plotAreaFrame].origin
            let location = CGPoint(
                x: value.location.x - origin.x,
                y: value.location.y - origin.y)
            print(location)
            // update state
            selectedRecord = proxy.value(at: location, as: ((String, Int).self))
        }
        .onEnded{ _ in
            // reset state when gesture ends
            selectedRecord = nil
        }
    )
This gesture might be confusing but don’t worry, let’s get it clear line by line.
OnChanged:
Let’s look at the image below: we know the location of the point (x,y) and the origin (0,0), and it’s clear that the differences between these two points are x ( = x - 0) on the x-axis and y (y - 0) on the y-axis. This is based on the origin being (0,0).

Selected point
Now, we don’t know the coordinates of the origin or the selected point but the geometry reader can provide us with the information. The local variable value in the onChanged closure is the value pressed on the chart overlay rectangle and we can get its location with value.location, which is a pair of CGPoint values. That being said, the coordinate of the selected point is (value.location.x, value.location.y).
Origin
let origin = geometry[proxy.plotAreaFrame].origin This line returns another pair of CGPoints, which represents the origin of the plot area of our chart.
Location of the selected point
Like we can know the point coordinate (x, y) with (x - 0, y- 0), now we can know that the location of the selected point is:
x = value.location.x - origin.x
y = value.location.y - origin.y
Plot
Then we can use this location to get the respective point in the chart plot area, with proxy.value . This function requires two parameters:
at: a CGPoint, here we’ll pass in the location of our selected point;
as: the type of plot value, which is the type of a pair of office and sales volume, hence
(String, Int).self
On Ended:
Whenever the users’ finger leaves the screen, we need to reset our state. So in the on ended closure, we can set the state value back to nil in order to hide the rule mark again.
Step 4 - Update the Rule Mark
You might notice that now when you’re dragging upon the chart, the rule mark will show up but not move with your finger/cursor. This is because we make the RuleMark’s value constant as 1200 during Step 1.
Now let’s update the RuleMark by updating the plot value from 1200 to selectedRecord.1 . Since selectedRecord is a tuple, selectedRecord.0 represents the office location string and selectedRecord.1 is the integer of sales volume.
if let selectedRecord {
    if (selectedRecord.1 > 0 && selectedRecord.1 < 5000) {
        RuleMark(y: .value("Sales", selectedRecord.1))
            .foregroundStyle(.pink)
    }
}
We’re 99% done, but just one more step: to present the value of the y-axis upon the rule mark - add a .annotation modifier and for its content, add a text of selectedRecord.1 to show the numbers too.
RuleMark(y: .value("Sales", selectedRecord.1))
    .foregroundStyle(.pink)
    .annotation {
        Text("\(selectedRecord.1)")
            .foregroundColor(.secondary)
    }
That’s all for today’s post. Hope you understood how the Overlay and Geometry Reader work. If you have any questions, please leave a comment. Remember to subscribe to my newsletter to get more posts like this. See you all tomorrow!