Charts in SwiftUI
In today’s post, we’re going to take a look at Swift Charts released during WWDC 2022. It allows us to create charts easier, in a declarative way.
Charts can be used to present complex or large-amounted data; with charts, we can help users quickly observe information, find trends, make comparisons and much more.
PS: This Swift Charts framework is only available for iPhones & iPads with iOS/iPadOS 16.0+ and macOS 13.0+.
The source code of the demo is available here.
Part 1 - Terms
To get started, let’s get more familiar with some terminologies first.
Mark - the way of presentation of your data. Swift Charts support BarMark, PointMark, LineMark, AreaMark etc. You might be already familiar with the concept of Bar Charts and Line Charts; basically, these charts are made up of units of the respective marks presenting the data being provided.
PlottableValue - typically a pair of x- and y- plottable values are needed to create a mark. And of course, there are cases where you need information only on the x-/y-axis. To initialize a plottable value, we need a value and a label.
ChartContent - the actual chart(s) created by chart marks. We can use its functions like .foregroundStyle or .opacity to customize it.
Part 2 - Different Types of Marks
Step 1 - Data Preparation
In this part, we’re going to create different charts to present the sales volume by sales office location. Let’s prepare a model and an array as the data source of our charts.
The struct SalesRecords has an id property, which is assigned with UUID at init. And the office location as a string while salesVolume is an integer. Note that the struct needs to conform to the Identifiable protocol to work with ForEach in SwiftUI. (Or not necessary if you specify id: \.office.)
//Model
struct SalesRecord: Identifiable {
    let id = UUID()
    let office: String
    let salesVolume: Int
}

//Data
let salesRecords: [SalesRecord] = [
    .init(office: "New York", salesVolume: 3000),
    .init(office: "San Fran", salesVolume: 2750),
    .init(office: "California", salesVolume: 4020),
    .init(office: "Denver", salesVolume: 930),
    .init(office: "Kansas", salesVolume: 2100)
]
Step 2 - Import Charts and Declare Chart element in a view
To use Swift Charts, we need to import the built-in package called "Charts". Then let’s add a ScrollView and a Chart element inside it. (Using a ScrollView because we’re going to work with multiple charts.)
import SwiftUI
import Charts

struct ContentView: View {
    var body: some View {
        ScrollView {
            Chart {
                // We’ll add chart conents here later
            }
            .padding()
        }
    }
}
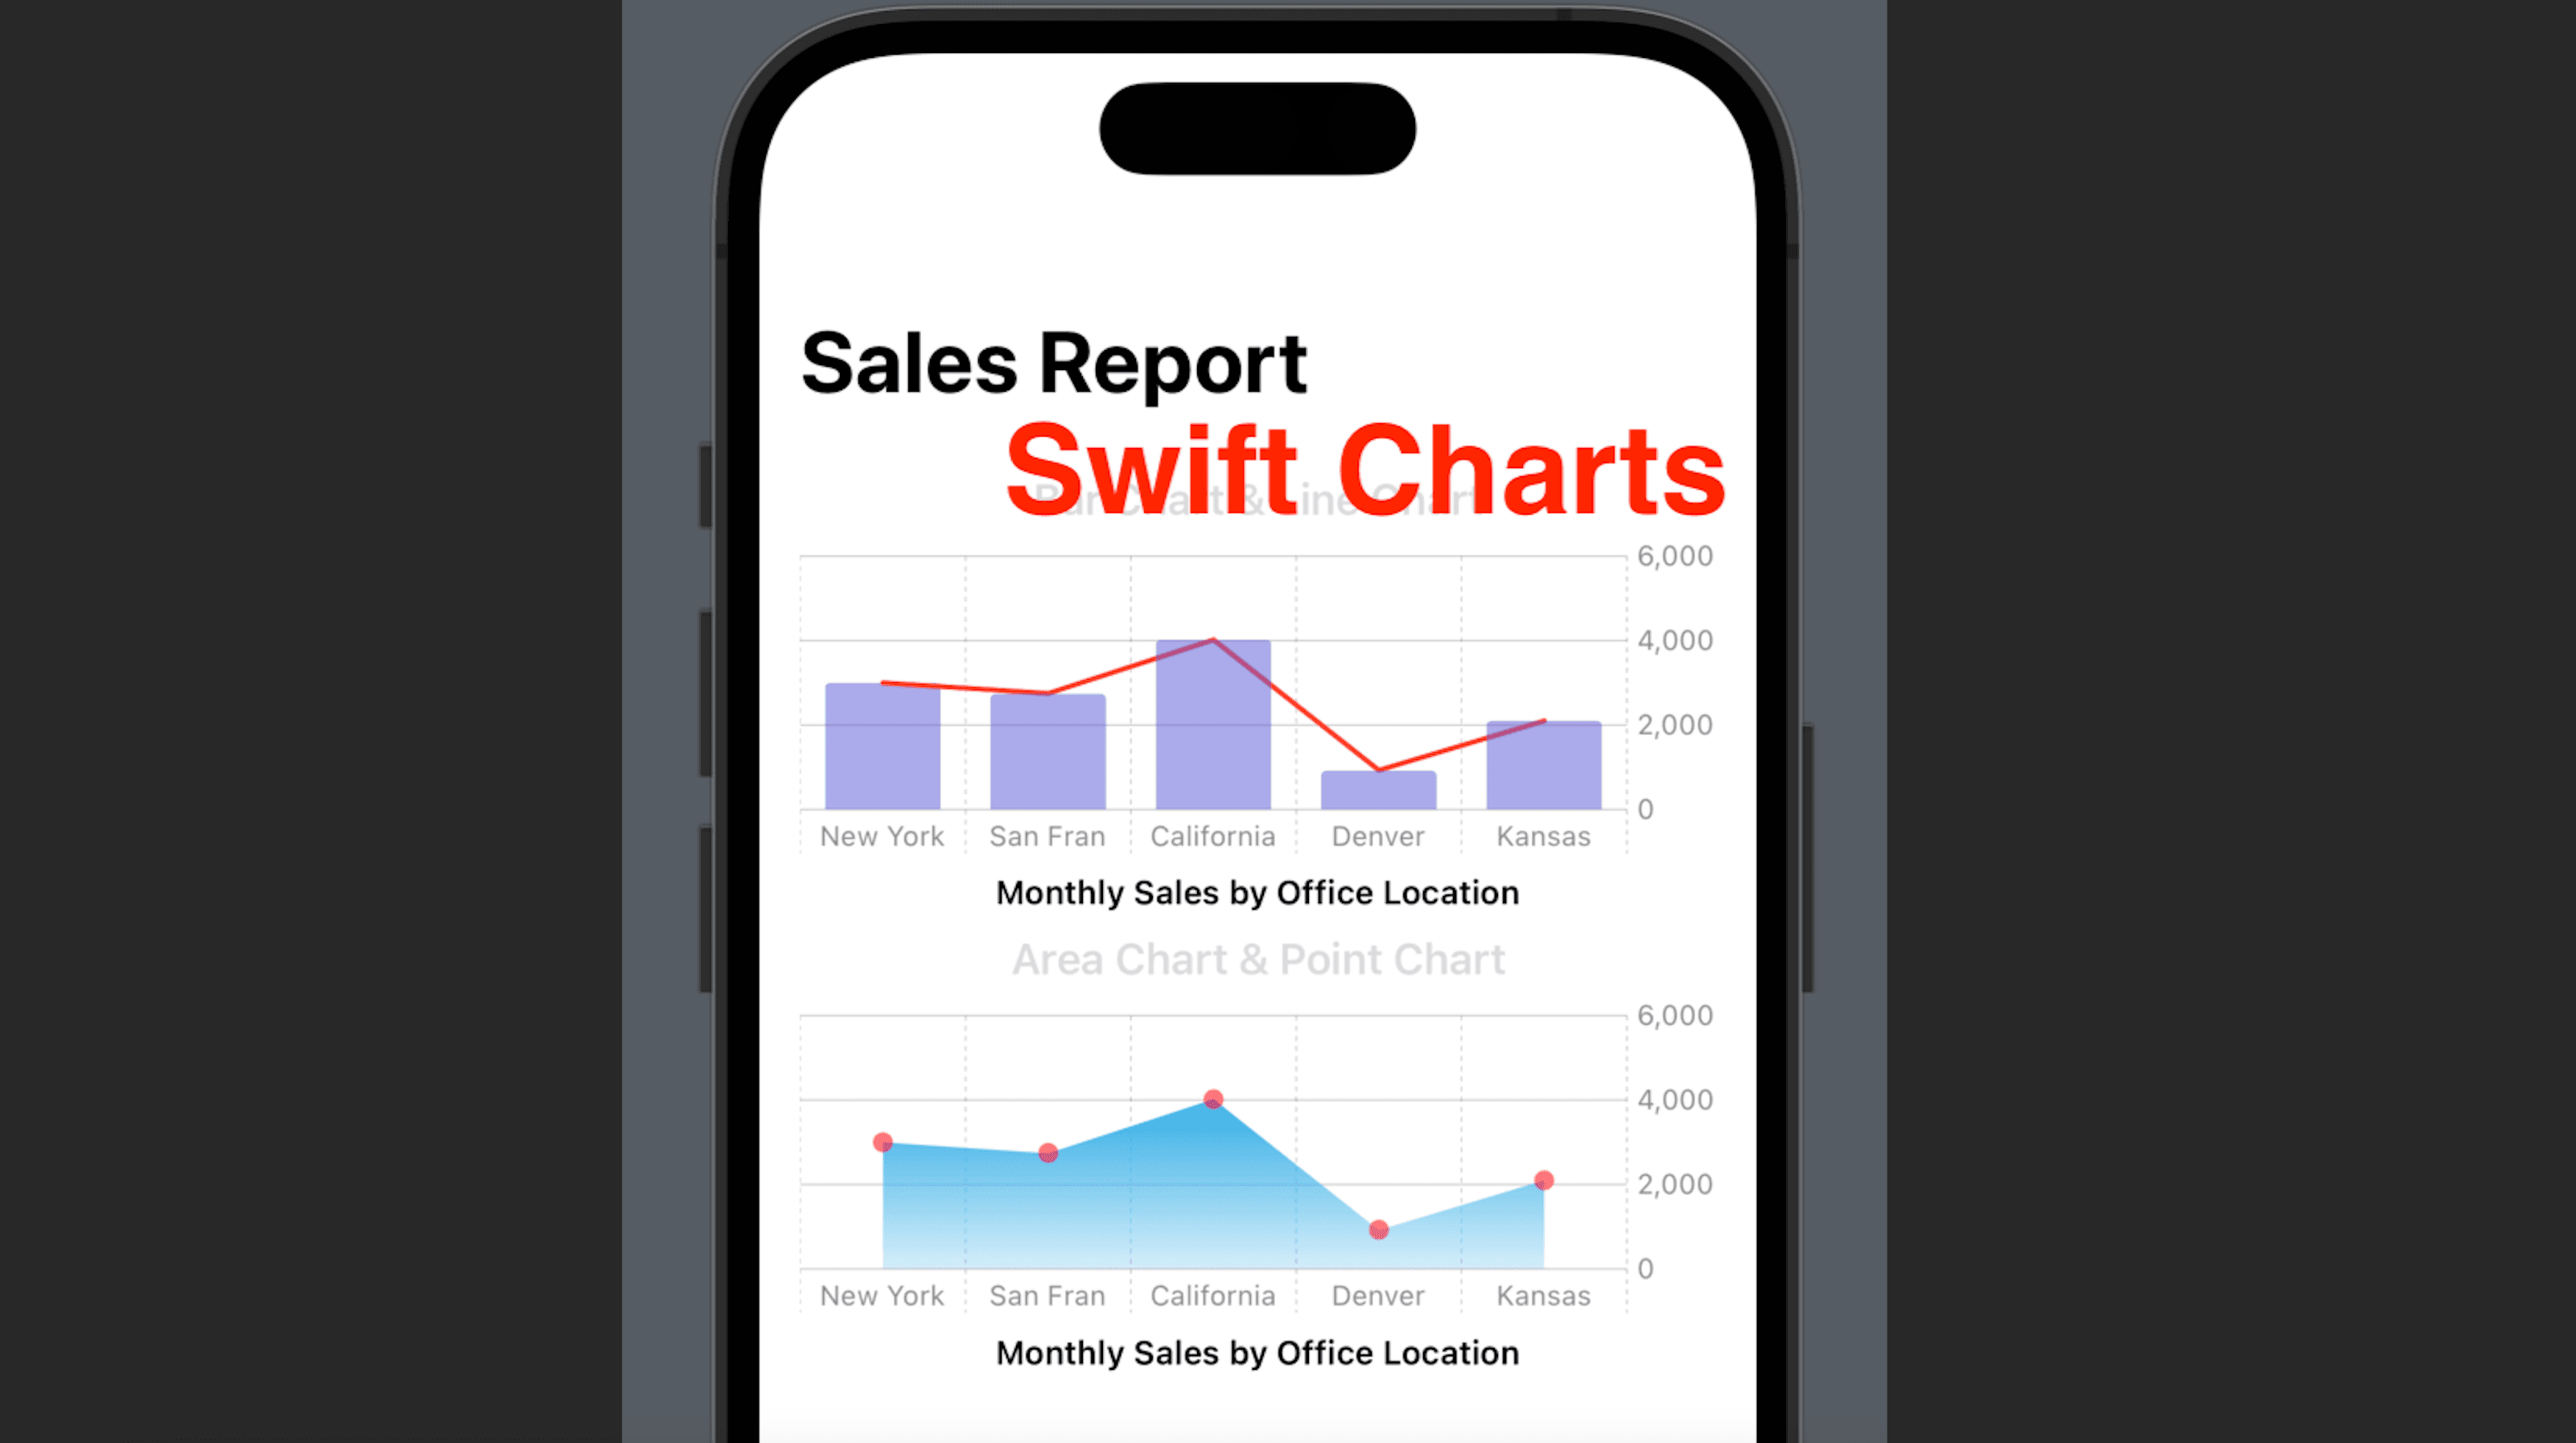
Step 3 - Add a Bar Chart
Add a ForEach within the Chart element, data source would be our array salesRecords. For each record in the array, we declared a BarMark with the office location string and its sales volume with a label. And that’s our first Swift Charts chart!
Chart {
    ForEach(salesRecords) { record in
        //Bar Chart
        BarMark(
            x: .value("Office Location", record.office),
            y: .value("Sales Volume", record.salesVolume)
        )
    }
}
Add you can add ChartContent modifiers to style it.
BarMark(
    x: .value("Office Location", record.office),
    y: .value("Sales Volume", record.salesVolume)
)
.foregroundStyle(.indigo)
.opacity(0.5)

Step 4 - Add a Line chart
A line chart is often used for trend analysis. In this demo, we’ll use the office location as the x-axis of our line chart.
We can add a LineMark in the ForEach we added in Step 3 to make the line chart shown in the same chart as the bar chart.
Chart {
    ForEach(salesRecords) { record in
        BarMark(
            x: .value("Office Location", record.office),
            y: .value("Sales Volume", record.salesVolume)
        )
        .foregroundStyle(.indigo)
        .opacity(0.5)
        //-------New lines: line mark in the same Chart element
        LineMark(
            x: .value("Office Location", record.office),
            y: .value("Sales Volume", record.salesVolume)
        )
        .foregroundStyle(.red)
    }
}

Step 5 - Area Chart with AreaMark & PointMark
Now let’s create another Chart element below the previous Chart element from Step 2. Add a ForEach with the same data source, and this time, add AreaMark and PointMark as the content.
This time the demo added a linear gradient color for the area mark, and you can see how the area gets clearer near the bottom.
Chart {
    ForEach(salesRecords) { record in
        AreaMark(
            x: .value("Office Location", record.office),
            y: .value("Sales Volume", record.salesVolume)
        )
        .foregroundStyle(.linearGradient(colors: [.cyan, .cyan.opacity(0.2)], startPoint: .top, endPoint: .bottom))
        PointMark(
            x: .value("Office Location", record.office),
            y: .value("Sales Volume", record.salesVolume)
        )
        .foregroundStyle(.pink.opacity(0.7))
    }
}

And that’s all for the demo. Some tips and reminders about charts:
Add Texts near the chart to indicate what the chart is about and data highlights.
Remember to import
SwiftUIandChartsfirst.There are much more about charts to explore. Such as more types of marks (RectangleMark, RuleMark), different ways to initialize a mark, format of x & y axises and background gridlines. Visit Apple’s documentation site for more.
I hope you got the idea to create simple charts with the Swift Charts framework. If you like posts like this, remember to subsribe to my newsletter to receive email version of my upcoming posts. ¡Hasta mañana!